
2022 is in the books and it ended up being the worst performance-wise since 2008. The S&P 500 lost nearly 20%, and the growth and tech heavy Nasdaq lost over 33%. The main culprits behind the losses were rising interest rates, a slowing economic backdrop, and a strong US Dollar. In our outlook technical piece for 2022 we said:
“We enter ’22 at lofty valuations still, compared to history. We think it will have greater significance this year… The Stock Market remains elevated (more expensive) than the bulk of the last 2 decades… Valuations become a problem for the Market historically when growth slows. Investors don’t want to overpay (high valuations) for slowing growth, particularly if companies aren’t profitable… Based on our work, we see growth potentially decelerating for the first time in the 2nd/3rd quarter this year. Part of this is the normal slow-down after a huge expansion, as we’ve seen in the recovery from the Covid crash in the Spring of 2020. 2021 saw serious strength. In 2022, the year-over-year comparisons will be very difficult. The pace cannot continue. This is a big component of our probabilistic call for a bigger correction in ’22.”
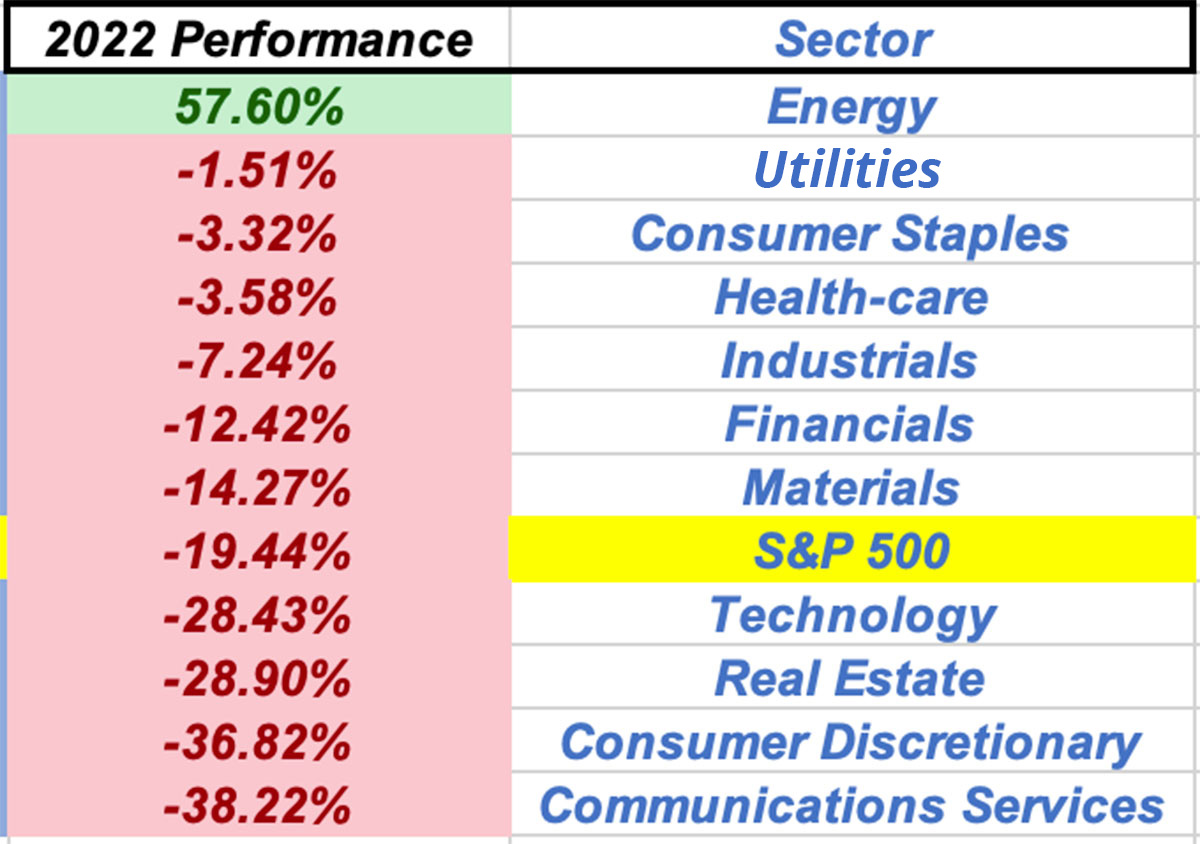
Because we had the stance that multiple contraction was probable, combined with slowing growth and higher inflation entering 2022, we shifted strategy on the equity side to a much more defensive posture in a number of ways. We rotated into areas that historically hold up and even grow in the prior mentioned macroeconomic backdrop. We stuck with Energy, added Utilities, Staples, increased Healthcare, while lowering our “cyclical” exposure to Technology, Communication Services, Financials and REITs. We lowered our historical volatility (risk) and lowered our beta (movement caused by indexes) in our portfolios, while increasing the fundamentals to more profitable, stable and higher cashflow generating companies. We favored “Value” over “Growth” as a way to express our stance.
Look at the scorecard of how the major Market Sectors faired last year: Our strategic move of adding to the areas that went down the least, and lowering exposure to areas that went down the most went a long way to help protect our downside in portfolios. We were not immune, but we were well insulated from the absolute carnage 2022 brought to most investors.
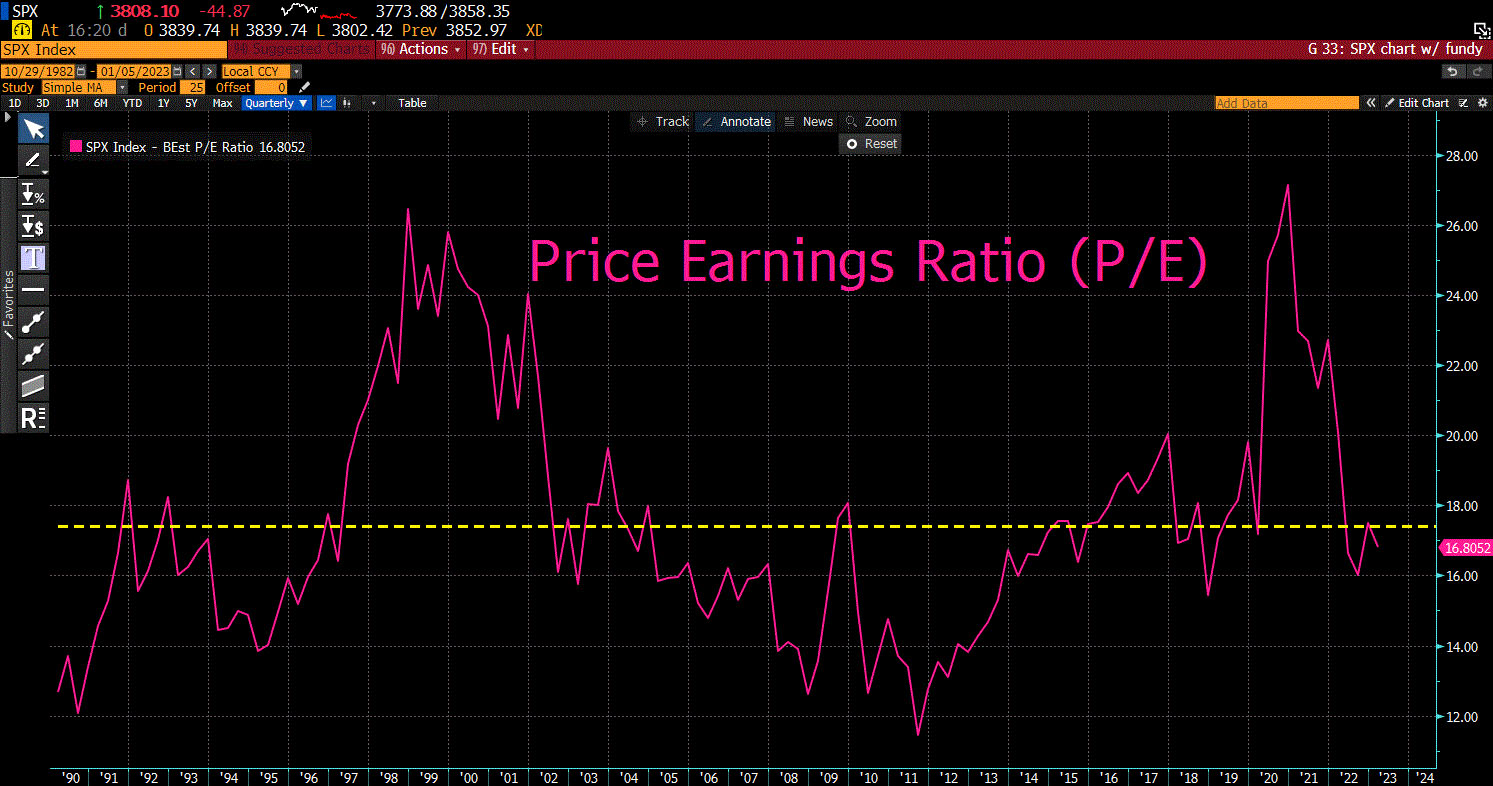
Did you know that earnings were positive last year? Yes, they ended up around +7% if Q4 estimates come in around expectations. So the entire Market decline was based on multiple contraction, or the Price (P) in the price/earnings ratio. The P/E corrected from over 22x entering 2022 and ended the year around 17x earnings. That’s what rising rates and expectations for slowing growth do, they discount the valuation in which investors want to pay for stocks.
We wish we had a bunch of optimistic, rosy, and Bullish things to say about the Economy entering 2023, but unfortunately, that’s just not the case. 2022’s Bear Market was all about interest rates and a recalibration in valuations. 2023 unfortunately is likely to be a continuation of slowing growth that actually hits earnings.
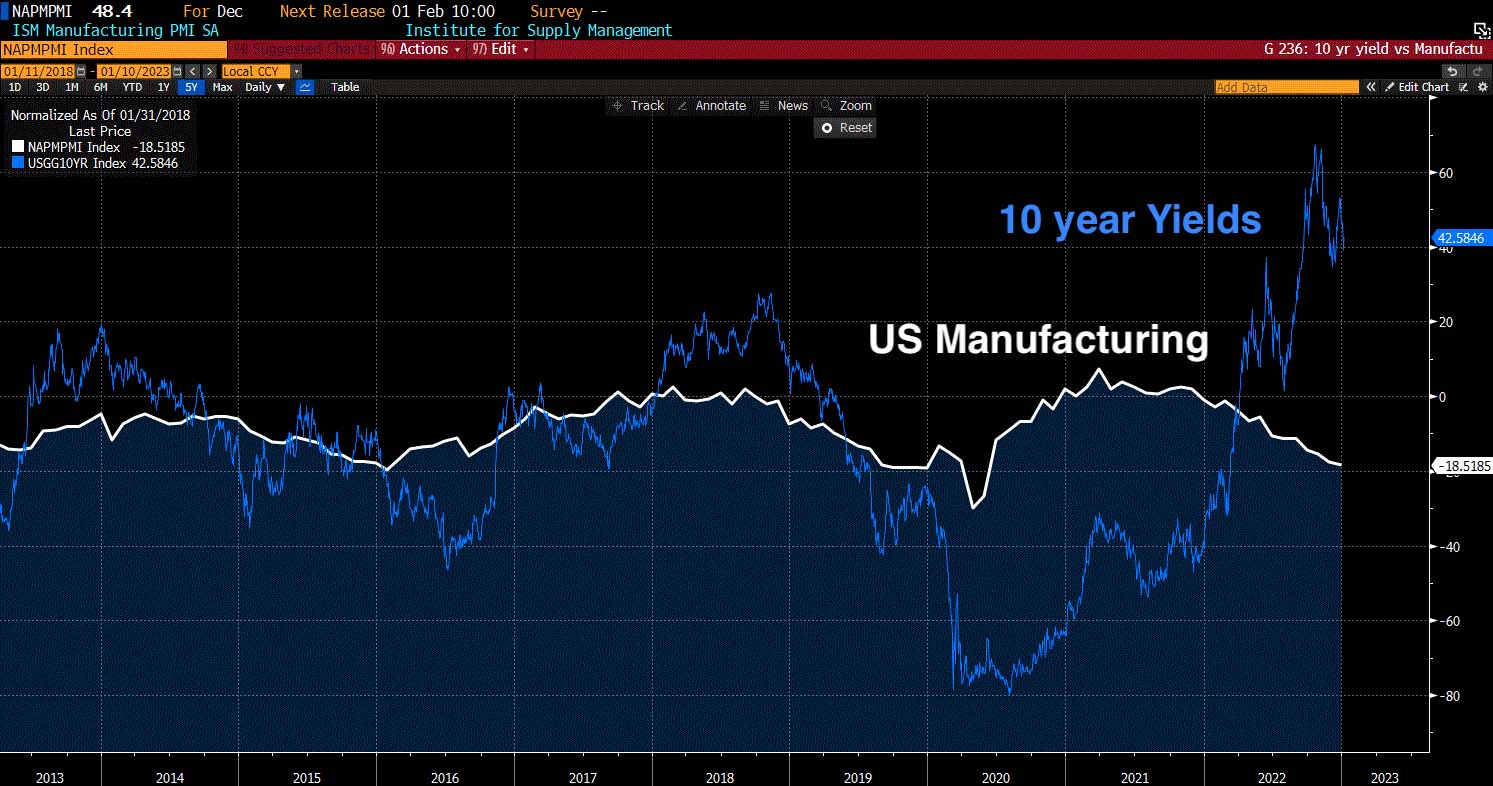
Below is one of many examples of the negative economic setup we are in right now. Manufacturing in the US has steadily decelerated since the Spring of ’22 and is now in full-fledged contraction, as you can see on the chart below. Worldwide there are only 10 out of the 40 countries we track in expansion as of NOV ’22. That means 30 out of 40 global economies are in contraction. So this is not just a domestic issue of slowing economic growth.
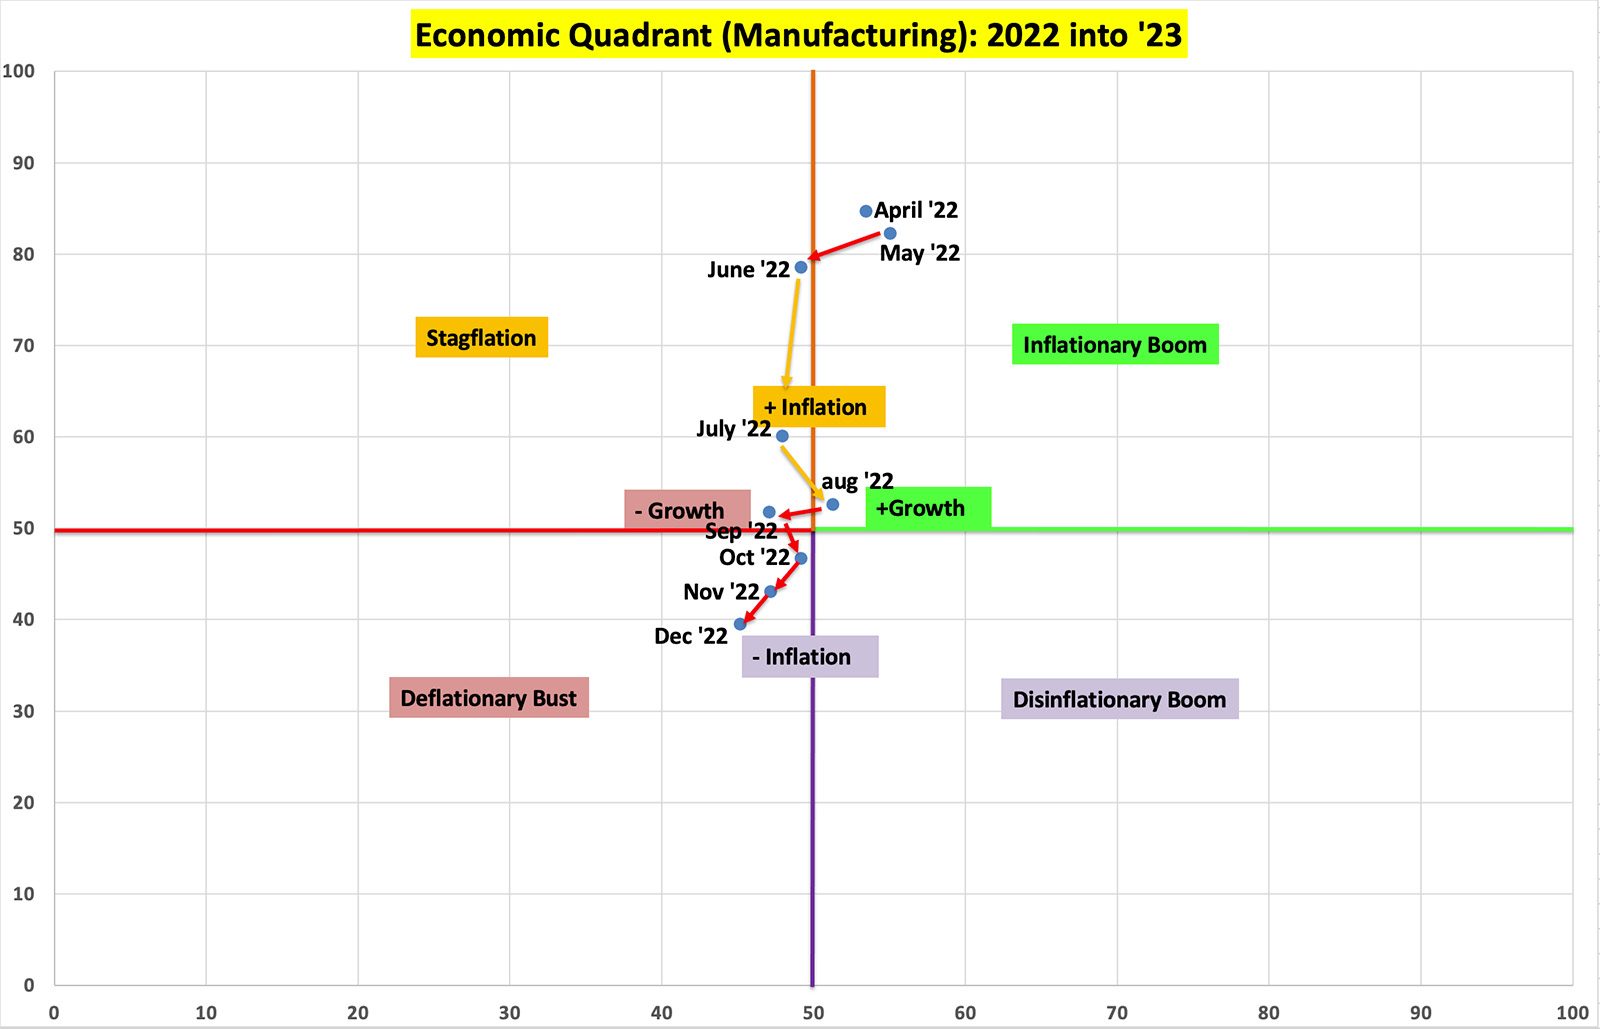
The area of the Economy that had been holding in much stronger was the Services side. It had remained in expansion all year in 2022, until December, when it fell the most since Covid and January of 2008. Now both Services and Manufacturing are entering 2023 in contraction and not showing any signs of stabilization yet. Our leading economic indicators unfortunately suggest these will continue to weaken well into 2023. You can see below the Manufacturing and Service PMIs are good indicators of where the SPX is headed, and right now they are headed in the wrong direction.

Past cycles when Manufacturing, home builder sentiment and traffic (housing) were slowing and in contraction, CPI (inflation) was well above 5%, the Yield curve was inverted, the Federal Reserve was tightening monetary policy, and unemployment rate was tight (low), it led to a hard-landing that took well over a year to relieve those recessionary conditions. Those periods were not kind to the Stock Market (Equities) as a whole. Those time periods were the mid 1970s, the early 80s, early 2000s (dot com) and 2007-2009 (Financial Crisis). Conditions are unfortunately similar today.
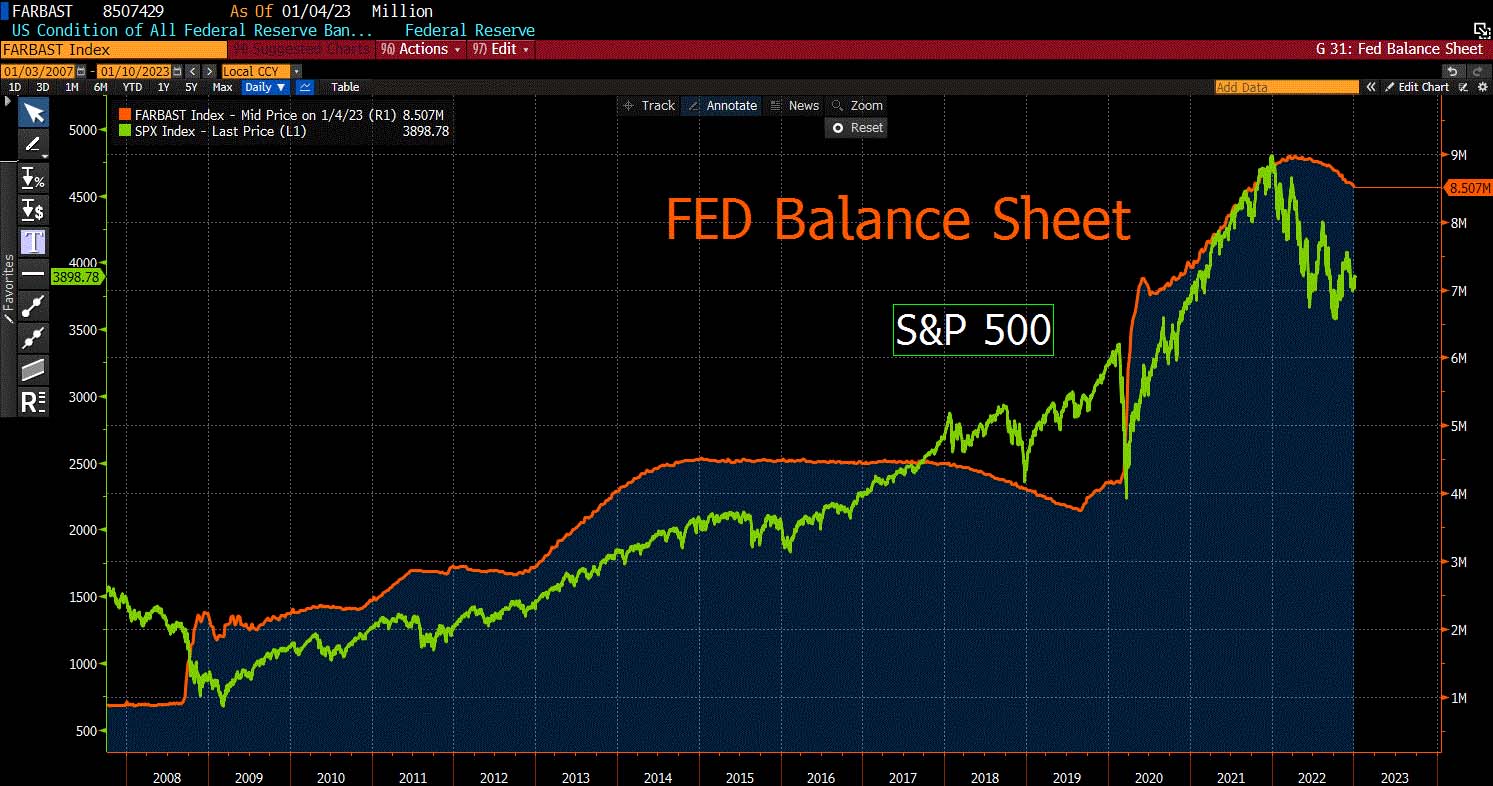
The Fed is draining liquidity from the system, for the first time since 2019, they started to decrease the size of the balance sheet (shown below). It is not a perfect relationship between equity prices and the Fed balance sheet, but the general path over time is definitely worth paying attention to.
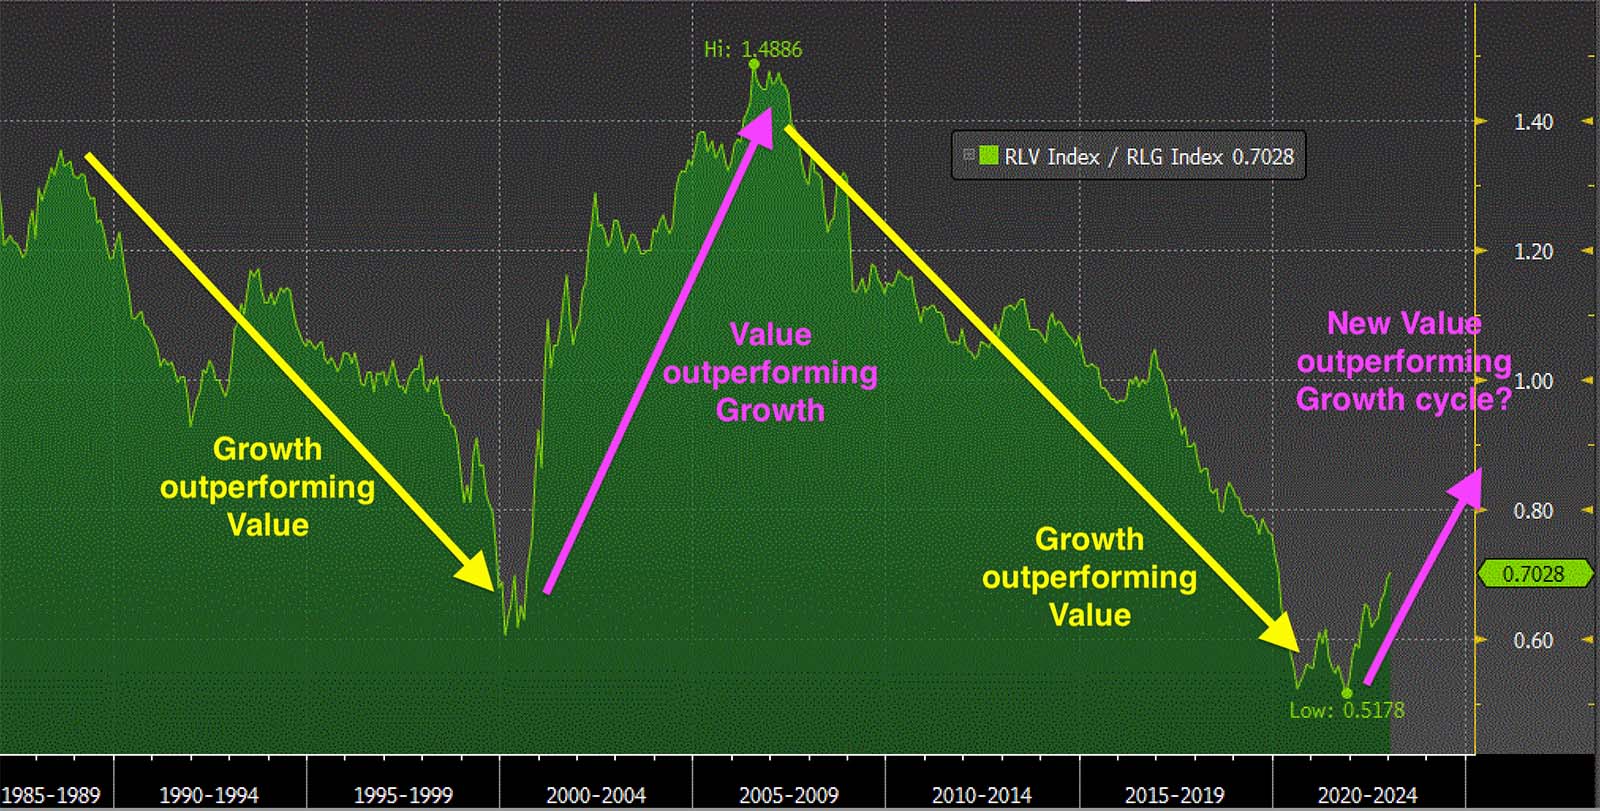
On average, what worked during those negative time periods? Defensive areas of the Stock Market (Staples, Utilities, Healthcare, lower beta, higher cashflow generating companies) outperformed the Market by a wide margin during those cycles. All the areas we rotated into last year and will continue to do so until this backdrop changes. We are likely entering a period where Value stocks outperform Growth stocks for years to come, much like the pink line on the chart below from 2000 through 2007. That was followed by a historic 14-year outperformance of Growth stocks over Value, the yellow line going down from 2007 to 2021. In fact, last year, Value stocks outperformed Growth stocks by 20% on average, and as you can see, the move off the lows on the chart below is barely pronounced. We believe there is much more room for this relative spread to increase in the years to come.
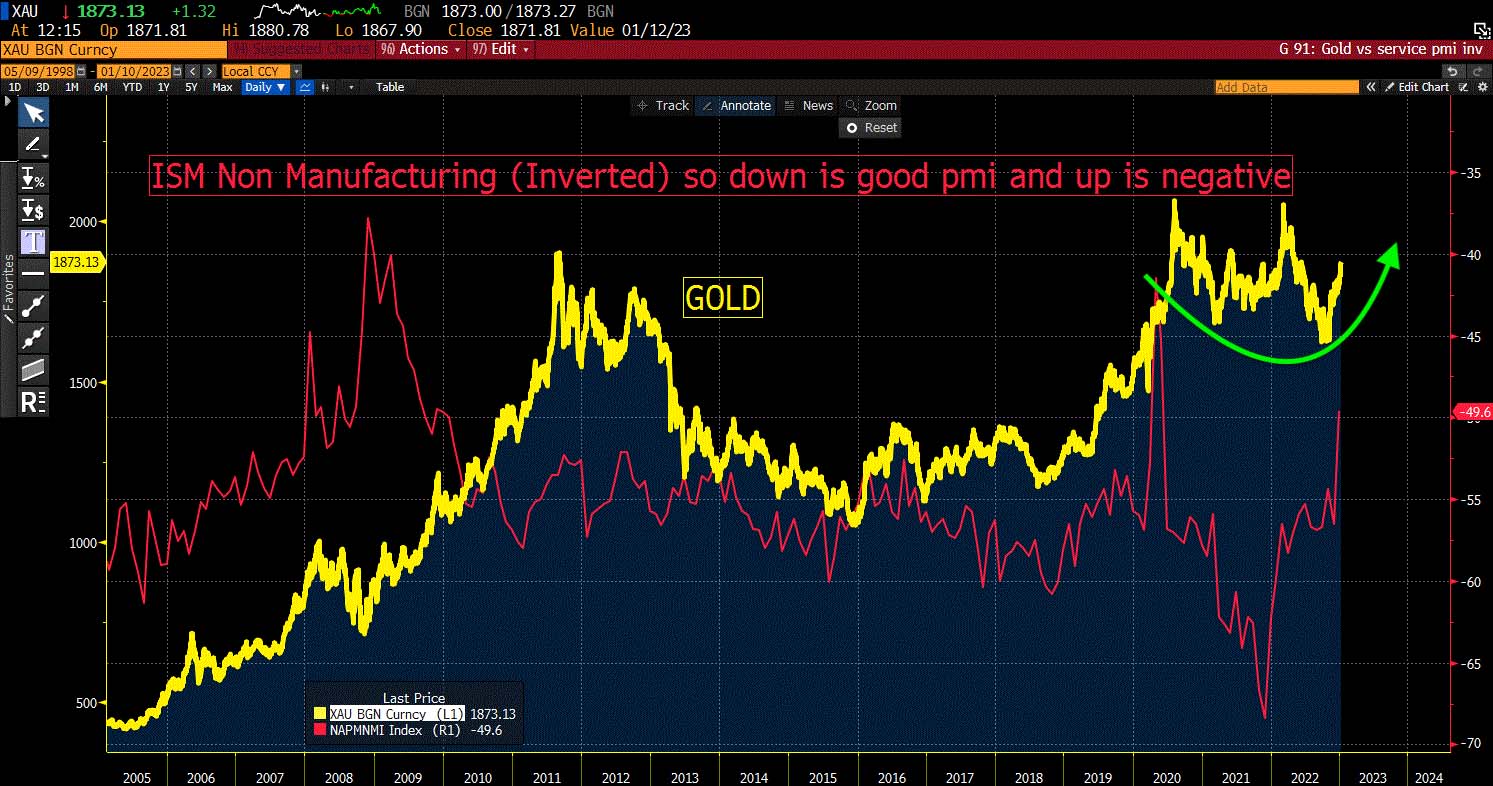
Precious metals also outperformed equities much of those cycles mentioned above. We continue to hold an overweight position and expect Gold to do very well into 2023, as shown below. Gold tends to outperform equities when the economic data is deteriorating. Below is Gold vs US Manufacturing. When Manufacturing is accelerating (expanding), the red line is going down on the chart below. You can see those are periods when Gold goes down or remains quite flat. When the Red line goes up (the Manufacturing in this example is contracting and falling), Gold likes it and does pretty well. We are in one of those periods; as you can see, the red line is starting to move higher as Manufacturing here in the US falls/contracts. Gold has been basing for the past 2 years, and technically setup to continue its Bull Market this year.
Historically when rates stopped rising after inflation peaks, interest rates ended up falling due to the economies entering deeper recessions; those time periods averaged positive returns as well for Bonds (remember when rates fall bond prices rise). We built back our fixed income portfolios in the 2nd half of ’22 in anticipation of this. Traditionally, there has been a symbiotic relationship between the Economy and interest rates (shown on the chart below). As the Economy strengthens, interest rates head higher. When the Economy is slowing and contracting, interest rates head lower. We expect this relationship to recalibrate in 2023, which would push interest rates lower or keep them flat, both of which would be Bullish for Bonds.
Markets don’t move in straight lines. Digesting the direction of the Economy and outright impact on earnings takes time, both on the upside and downside. Last year we had multiple sell-offs and multiple 10+% Bear Market rallies. We expect 2023 to be much of the same. We plan on utilizing index exposure to take advantage tactically of these large moves, just as we did in 2022.
Did you know in the 3-year Bear Market from 2000 to 2002, there were 11 rallies of more than +10% and 4 rallies that were over +25%?!?! It was a process, it took time, but there were many opportunities inside that Bear Market for active managers. Buy and Hold was not successful during that time and many other Bear Market cycles. That’s where we enter, active management is our strong suit and we will continue to be active in 2023 as this Bear Market runs its course. We will continue to trade around positions, manage risk, use hedges when appropriate, and take advantage of powerful rallies on the offensive when we can.
As always, we will continue to dynamically assess what our inputs are telling us and position portfolios appropriately.
Have a nice weekend. We’ll be back, dark and early on Monday.
Mike Harris