
As we turn the corner into the 2nd half of the year, we thought it timely to show a few Big Picture metrics we follow to help give a sense of where the economy and markets sit.
Jobs
The June jobs report came out today and was about where we expected it to come in and stabilize the run rate of annual jobs created. After the economy broke positive in 2011 from the financial crisis we have averaged a run rate of +2.14 million jobs created annually. Today’s report puts us right back at that trend at +2.18 million created. For reference, the hottest peak labor market hiring was +3.3 million in February of 2015.
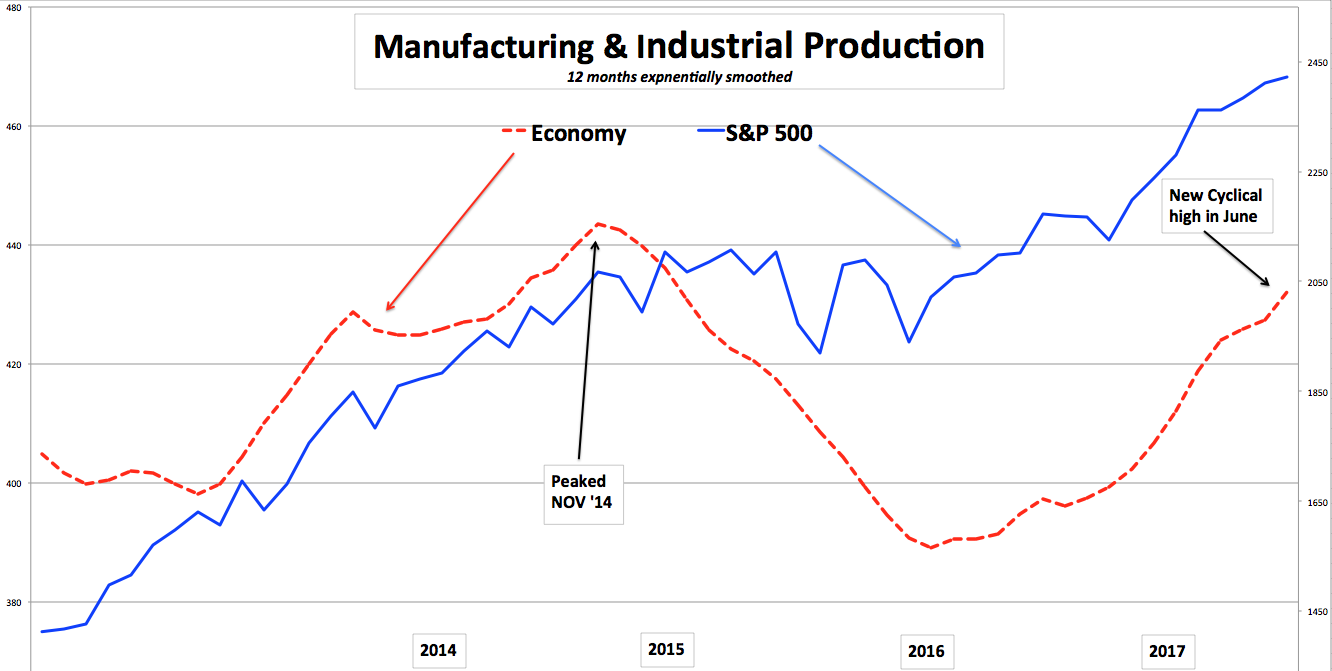
Manufacturing & Industrial Production
Both hit new cyclical highs in June after peaking in late 2014. If you recall we saw the S&P 500 go through a flat period from 2015 to early 2016 as these numbers started to slow. Manufacturing & Industrial Production started to show expansion last fall which gave clues the economy was about to expand again after resting for a year and a half. These are both humming along as expected for a strong fundamental backbone of the markets.
The Bond Market
We saw the 10-year Treasury yield start 2017 at 2.45% and drop to a low of 2.14% in June. Fast forward a few weeks and the 10-year Treasury yield is pushing back to 2.40%. What was unique about this move down in interest rates at the longer end of the Yield curve, was how much the Yield curve Flattened, because the front end actually rose. What does that mean? The Yield curve is measured by taking the 30-year yield, or furthest out in time, and subtracting the 1-month bill or 3-month bill yields, or closest to today. The yield curve was 2.62% steep as we began 2017. Now a few weeks ago the curve “flattened” from that 2.62% all the way down to 1.85%. Why is this important? Often times when the Yield curve inverts or goes negative (pays higher rates in the front maturities then the further out maturities) it is a big sign of economic weakness and potential recession. For reference the last “Inverted” Yield curve we saw was in 2006/2007 and we know what followed a year or so later.
The Yield curve since that 1.85% low has “steepened” back towards 2.0% in a quick 2 weeks. This is exactly what we want to be seeing in tandem with rates beginning to move back up. The end of the curve is moving up more than the front again.
Earnings & Revenues
Earnings rose 13% and 5% for Q1 and Q2 respectively, while Revenues rose 8% and almost 4% for the first 2 quarters. Earnings are still on pace to grow around 12% for 2017 and revenues around 6%, which would be sufficient to earn $128 a share and support our 2500+ target on the S&P 500 this year.

There will continue to be quick dips and vacillations along the way, but from our perch these are not the characteristics of a stock market top. They continue to look like very normal “late stage” economic cycle fundamentals.
Have a nice weekend.
Mike Harris