
On Monday of this week, Treasury Secretary Yellen communicated that the borrowing needs of the Treasury were much higher than expected. The Treasury Department announced debt issuance for the next few months would now need to be in excess of $1 Trillion with a capital T, up from $700 Billion from its May update. They took up issuance amounts for the Fall and Winter time periods as well. These are huge numbers that the Market needs to absorb.
Tuesday afternoon, after US Markets were closed, Fitch proceeded to downgrade the United States of America’s Sovereign debt rating from AAA to AA+. You may recall the last time the US was downgraded was by S&P (Standard & Poor’s) way back in August of 2011. Fitch decided to call out the US on its problematic debt and budget deficit path; it’s been a while since Washington has had any agency call them on their path. This is hopefully a well-needed shot across the bow.
Fitch stated: “The rating downgrade of the United States reflects the expected fiscal deterioration over the next three years, a high and growing general government debt burden, and the erosion of governance relative to ‘AA’ and ‘AAA’ rated peers over the last two decades that has manifested in repeated debt limit standoffs and last-minute resolutions.”
Fitch also forsees a recession coming, which will put additional strain on the Government’s finances.
The Markets reacted Wednesday with the first down 1% day in over 2 months. Volatility increased, and it was a traditional risk-off day.
This was a bit eerie to me as last weekend, I was planning for the upcoming week and thinking about a topic for the TGIF. We have been doing a lot of work on our nation’s fiscal situation and future pathway. I planned on writing a detailed piece about the US debt, deficit, budgeting, interest on the debt, and all the like, as an ongoing larger macro issue we would have to ultimately deal with.
Well, this news made it timelier and more front and center. Let’s jump right in…
So is this downgrade a big deal? What are the ramifications? How are we viewing this?
All great questions!
In our view, the Market reaction this week was more of a reaction to a Market being overbought, sentiment reaching extreme bullishness, and a small recalibration of higher rates. Volatility had been extremely low as of late; investors have moved nearly “all in,” as many sentiment data surveys show, and valuations have been moving higher and higher. This downgrade was a reason to get some selling back in the Market that had been a 1-way street for months.
Immediate Impact: Investors rely on credit rating agencies to help assess the risk that borrowers cannot repay their debt. Borrowers with lower ratings compensate investors with higher interest rate payments. As a result of the decision by Fitch, some US companies will actually have a higher AAA rating and be considered more creditworthy than the US Government (Think JNJ and MSFT). Given that many investment funds are required to hold only AAA-rated securities, another downgrade (Moody’s still holds the US at AAA rating) could force some institutional investors to divest from Treasury Securities and raise the cost of servicing the growing debt, opening up the possibility of forced sales for compliance reasons. Others will be forced to adjust their policies to account for the shift.
This downgrade doesn’t change the fact that the US Dollar is the World’s reserve currency (The Dollar rallied strongly on Wednesday following the downgrade!). So, is this a big deal? The short-term answer is no, not on an immediate basis. The Dollar and Treasuries remain the safe-haven currency and debt in the Global Economy for the foreseeable future.
The long-term implication of the downgrade is not immediately knowable, but it is a risk. That risk is the continued rise in our debt level, the cost of servicing that debt, the potential crowding out effects on our Economy, and subsequent growth expectations being forced to go lower.
First, we want to start by stating the obvious: this is an apolitical run-through. We have no axe to grind politically. We objectively view the financial matters of the US in aggregate as part of the larger macroeconomic framework of analysis.
The USA sits today with a burgeoning debt level of $32.6 Trillion. We entered this century with $5.6 Trillion in debt outstanding.
Here’s a chart going back to the start of 2005 showing you the exponential increase in our Total Nation’s debt outstanding. This exponential rise has spanned through 4 different Presidents and two political parties, from Bush to Obama to Trump to Biden; it hasn’t gone down during any of them.
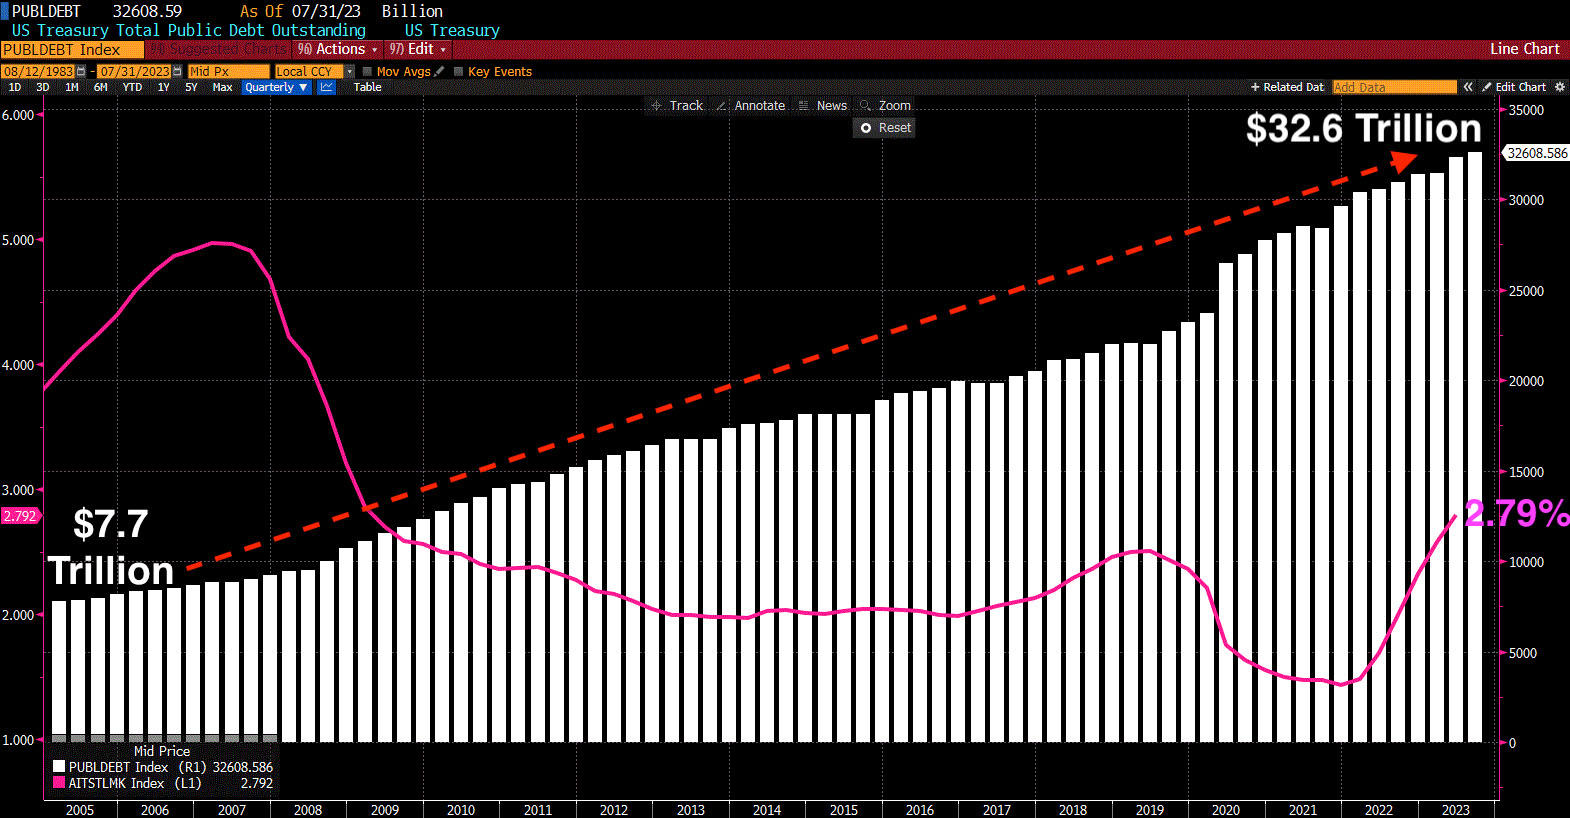
The pink line on the above chart is the % interest rate the US Treasury pays on this debt. It is currently sitting at 2.79%, and set to continue to head higher from here as the Treasury has to continually roll out debt coming due at higher interest rates.
What is frustrating is that we have witnessed unprecedented low interest rates from the financial crisis until now, and the debt has continued at its torrid pace higher, as you can see on the chart. Most of this increase is spending in excess of what the government takes in, not a ton of interest compounding. Now we have interest rates moving higher for the first time in 14 years, and interest is becoming a larger and larger slug to cover; this is a problem.
The federal debt held by the public is over 100% of GDP and going higher; that means that US Government debt is greater than the value of goods and services the country produces each year. If deficits rise, it will go up, as Fitch notes in its downgrade commentary. Only at the end of WWII has the debt of the US been higher as a share of the Economy. But instead of Millions of soldiers coming home to enter the workforce, we have a growing population collecting Social Security and Medicare today.
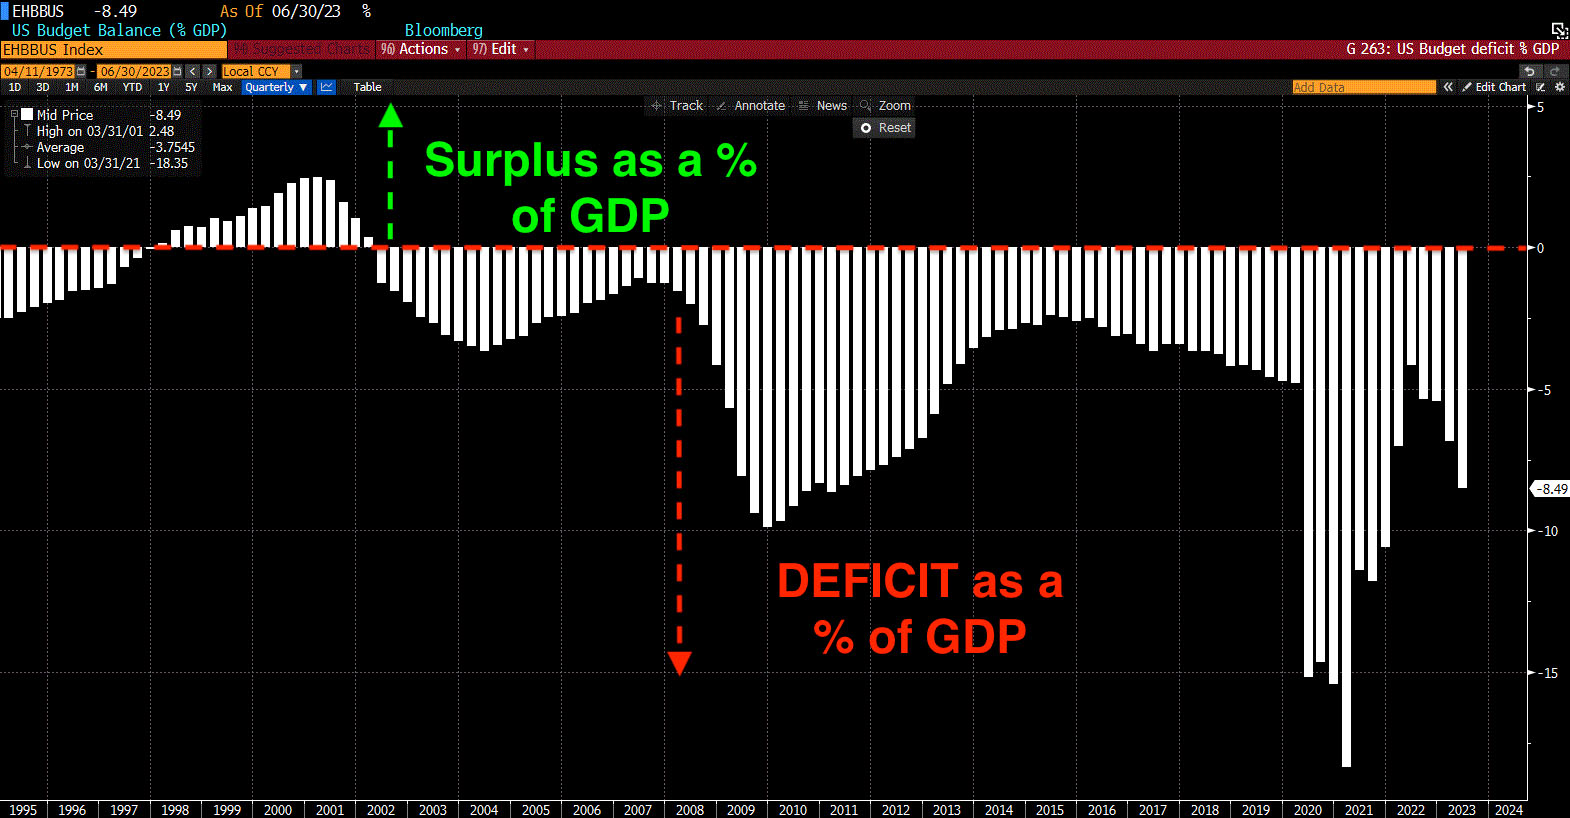
When was the last time we actually ran a surplus, you may ask? You know, the old way of doing things, in good economic times, when the Government took in more tax revenues than it spent, thus running a surplus for a rainy day to keep the National debt the same or even pay it down and retire some.
We have to go way back to 2001, the last time the US Budget balance was in the black as a percent of GDP.
Since then, it’s been a steady budget deficit as a percent of GDP each and every year. The annual budget deficits have run from the low single digits in a good year to the incredible -18% of GDP in 2020.
Here’s another way to look at it visually on the below chart. The yellow line below is how much we spend annually (Outlays). The blue line is how much we bring in (Receipts). The last time the blue line was above the yellow line was 2001 (brought in more than we spent). Every year since, we’ve spent more than we have received. You can even see where the dotted lines are going (these are the Congressional Budget Office estimates through the rest of the decade). There is currently no plan in place to stop this deficit spending.
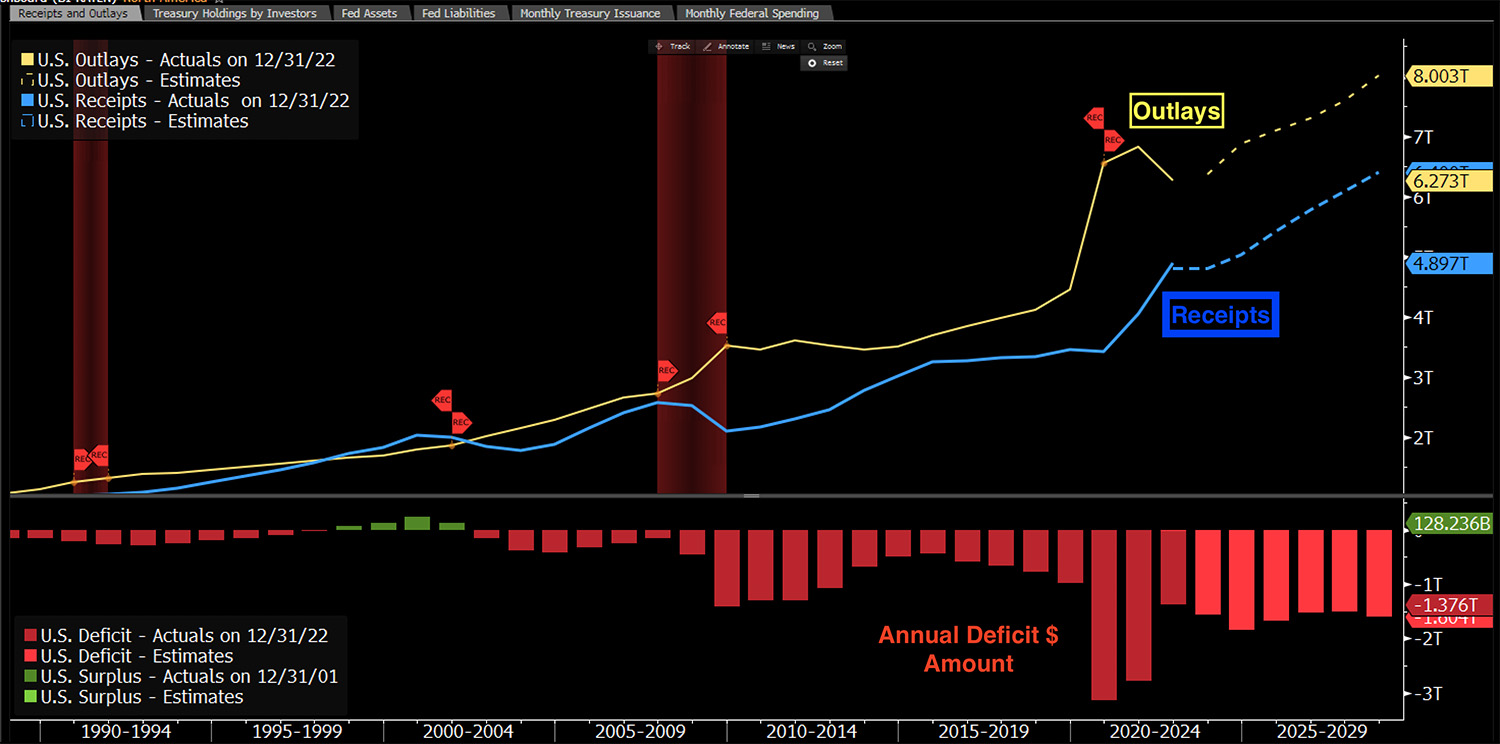
Simply put: The red bars at the bottom of the above chart are the annual $ deficits or what gets tacked on to our total debt every year. That’s how the number has grown to $32+ Trillion from $5 Trillion at the turn of the century.
This is exactly the point of Fitch’s downgrade this week is making. By doing this they’re saying: Hey, listen USA, wake up and look at the past 20+ years and the path you are on. Some adjustments need to be made. It’s not too late yet, but every year you don’t change and wait and postpone, the quicksand just gets heavier and heavier.
Okay, so you can see where we are and how we got here. What does it mean moving forward?
Let’s put the interest in perspective:
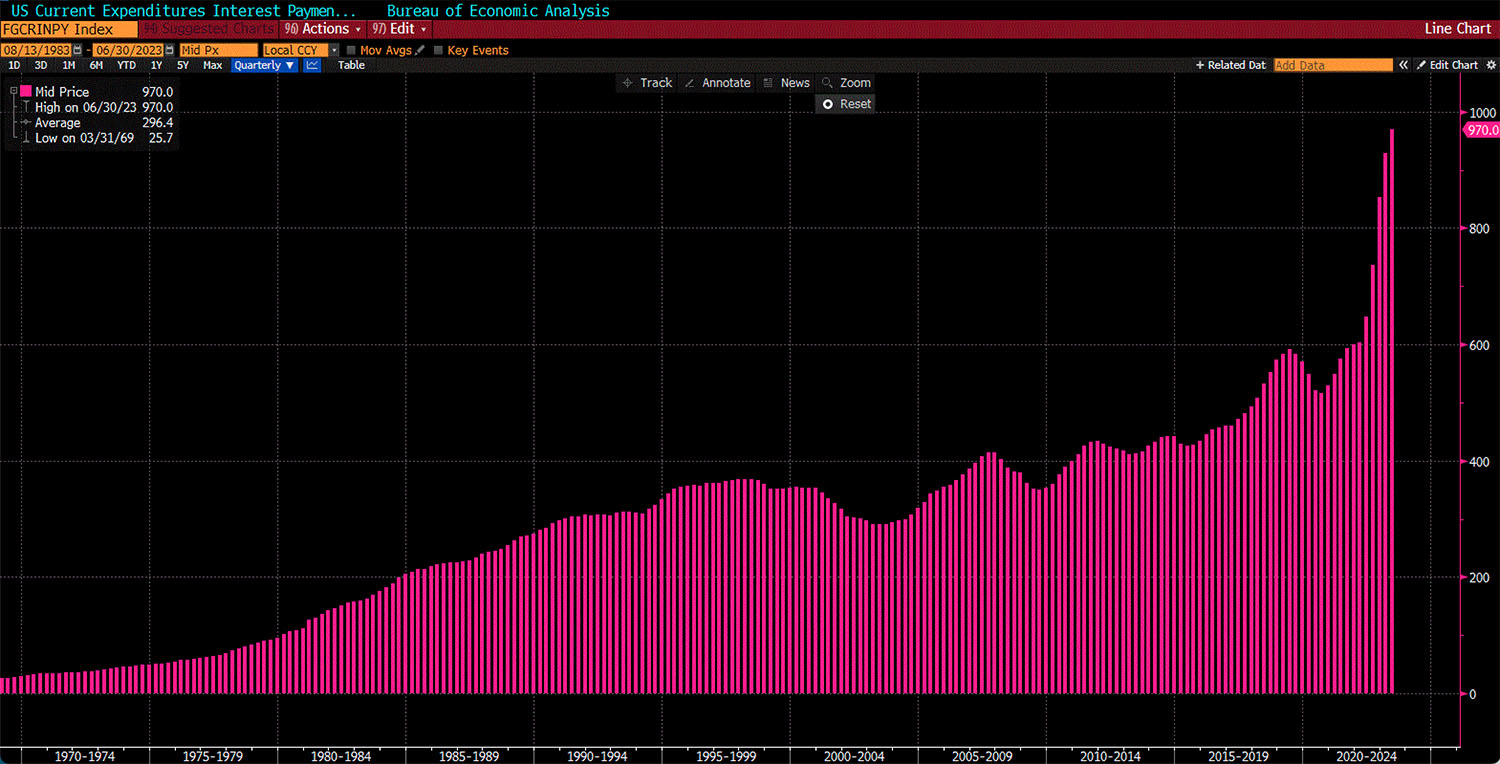
$970,000,000,000
That is what the US Treasury is paying out in interest on an annualized basis this week. $970 Billion, too many zeros to count on our fingers. Any day now, we will reach the $1 Trillion mark in annual interest on the debt. This number grows next week, the month after, the year after, and on and on. You can see this explosion higher on the chart below, which goes all the way back to the 1970s. Yes, the US Economy is much larger today than it was in the past; i.e. GDP is much larger, which is why FITCH and ratings agencies use a % of GDP in their calculations.
Let’s put this interest burden in context. Again, when you are dealing with Billions and Trillions casually being thrown around in media headlines, sometimes it’s hard to make any sense of it.
As of this Summer, on an annualized basis, these are the top 5 biggest expenditures of the US Government:
| Category | Amount |
|---|---|
| Medicare | $1.37 Trillion |
| Social Security | $1.21 Trillion |
| Defense Spending | $787 Billion |
| Health Spending | $782 Billion |
| Income Security | $630 Billion |
See where interest on the debt fits in? Interest will be the 3rd largest expense, moving higher than defense spending next year in the budget at $1+ Trillion.
Interest will be roughly 15-17% of the total US budget in ’24. Looking back 40 years, interest on the debt has averaged 9.8%. Social Security and Medicare have averaged 13.2% and 10.2% of the annual budget. Interest will now grow larger than those 2 major entitlements in the not-too-distant future.
Suppose interest rates went up from 2.79% today (the interest rate the Treasury is paying currently on all debt outstanding) up to 5%. The Net interest on the debt every year would be as much as the 1-time Covid epidemic relief spending in 2020. Think about that. That was a one-time, once-in-a-100-year event, right?
Now spend that amount every year, into perpetuity, just on interest on the debt. You don’t get anything for that spend other than the spending side of the interest payment recipients. Not nearly the multiplier effect of other spending alternatives to boost economic growth.
Moreover, Fitch notes: “Over the next decade, higher interest rates and the rising debt stock will increase the interest service burden, while an aging population and rising healthcare costs will raise spending on the elderly absent fiscal policy reforms.”
Today if you add the biggest 3 spending categories of the US Budget: Health Care + Social Security + Interest on the Debt = 68% of all Tax Revenues.
The Congressional Budget Office (CBO) estimates by 2040, those 3 will be 100% of all Tax revenues.
And by 2050, they will be 115% of Tax revenues.
Nothing for Defense, nothing for National Institute of Health (NIH), nothing for Education, nothing for Transportation, nothing for Veterans, nothing for Employment and Training, nothing for Science (think NASA); it goes on and on.
This is a major issue for future economic growth, and productivity and investment spend. The ultimate crowding out effect. This is the bigger WHY to what Fitch did this week.
We have a bit of a demographic problem that’s starting to hit. After WWII, people had a lot of babies, babies boomed, pun intended. The birthrate coming out of WWII was 3.7; today it currently sits at 1.64. All those babies after WWII are the Baby Boomers.
Those Baby Boomers are turning 65, and they are notably living longer thanks to modern medicine. The problem is the current generation isn’t having as many kids, way less, in fact. So now we have a disproportionate weight of older Americans who are receiving entitlements without enough younger Americans creating revenue to pay for them.
Has this happened before?
Yes, in Japan. Back in 1987, for the first time in Japan’s history, their birthrate dropped below 1.7. They had had a steady rate well above 2 and 3 for the 30+ years prior to that. They had an aging demographic problem. Japan was the first Industrialized Economy to have its central bank roll out quantitative easing, to try to extrapolate more growth from a stagnant Economy. Ben Bernanke actually used part of Japan’s QE exercise here in the US during the financial crisis. The Japanese Stock Market, the NIKKEI, topped in 1989 and has not been higher since. That’s 34 years without any progress.
Can you imagine if the US Stock Market didn’t go higher for the next 30+ years? A little unsettling to think about. To be clear, of course, there are many, many differences between the Japanese Economy and ours. Differences in cultures, differences in spending, differences in trade and geographical locations, and on and on. This is merely an example of what the crowding out effect can do.
Fitch gave us, the USA, a wakeup call, after S&P did similarly 12 years ago. We chose not to use 2011’s warning as an act for any change. In fact, we racked up another $18 Trillion to our outstanding debt since S&P’s downgrade, without even 1 year of a budget surplus.
Will we finally take this one as a true warning to enact change? Or will we continue the same behavior we’ve just chronicled over the last 20+ years?
The costs are high of doing nothing, and the sacrifices are great if real change is to be enacted. Cutting entitlements isn’t popular, not one bit. Raising taxes doesn’t have a lot of fanfare, either. Difficult decisions need to be made. Compromise is required. We will continue to follow the developments closely.
Have a good weekend. We will be back dark and early on Monday.
Mike Harris